|
Infographics are increasingly being used for business communications and consumer marketing. But what is an infographic, how should it look, and what tools do you need to make one? The Infographic Defined An infographic is a visual representation of information in the form of charts, pictures, graphs, etc. The goal is to present complex information in a clear way, but more specifically in a way that can be digested quickly by the reader. In fact, some studies show that infographics are 30 times more likely to be read than traditional text presentations. Advantages Infographics are more interesting to look at and take less time to interpret than traditional text reports or presentations. They have been used for years to represent scientific or mathematical data, and only now are becoming more widespread in popular media. Because they are more dynamic and colorful, they seem to be more attractive to a culture that no longer has the patience to read long articles. Infographics Are Everywhere You can find infographics in your everyday life just by picking up a newspaper or book.
Take a look around. Any picture you see that conveys information and isn't there just for cosmetic purposes is likely an infographic. Infographic Examples I have pulled some images from Creative Commons to help you see infographics in action. The first one is from The Children's Museum of Indianapolis: 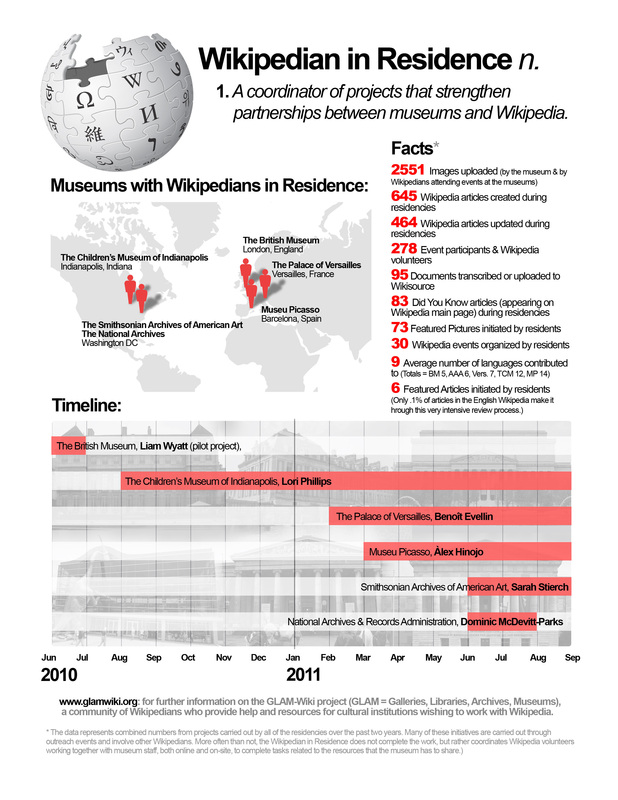 The next one is from the Oregon Department of Transportation: 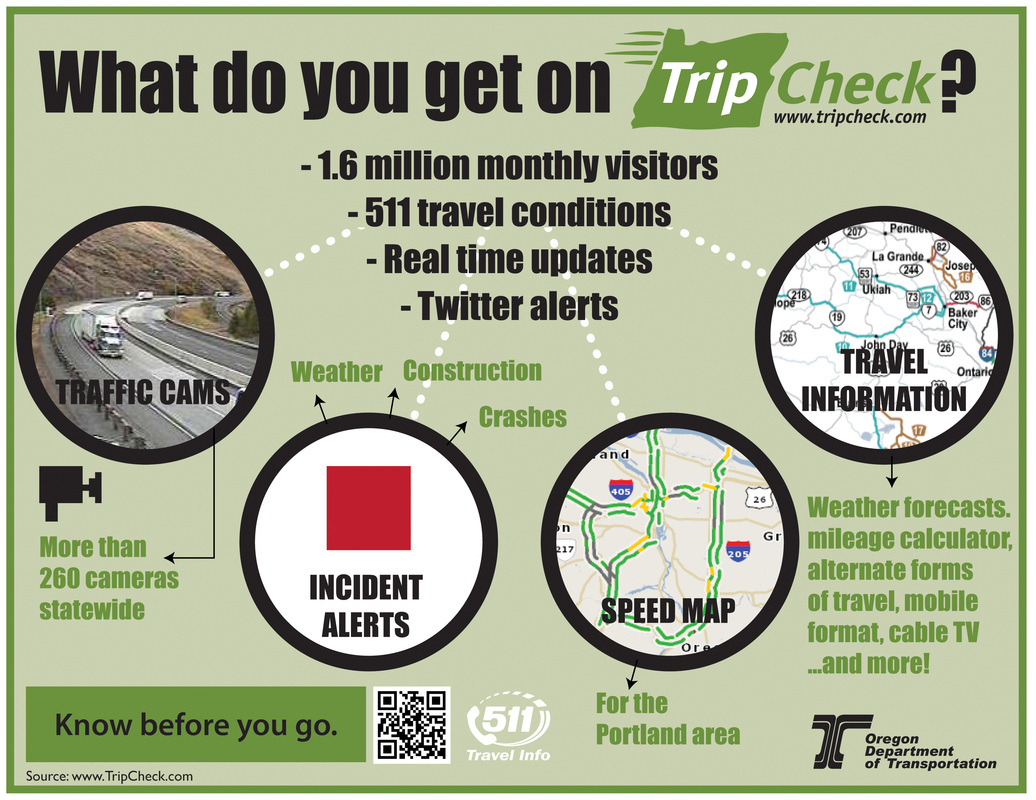 A final example is from Intel Free Press: 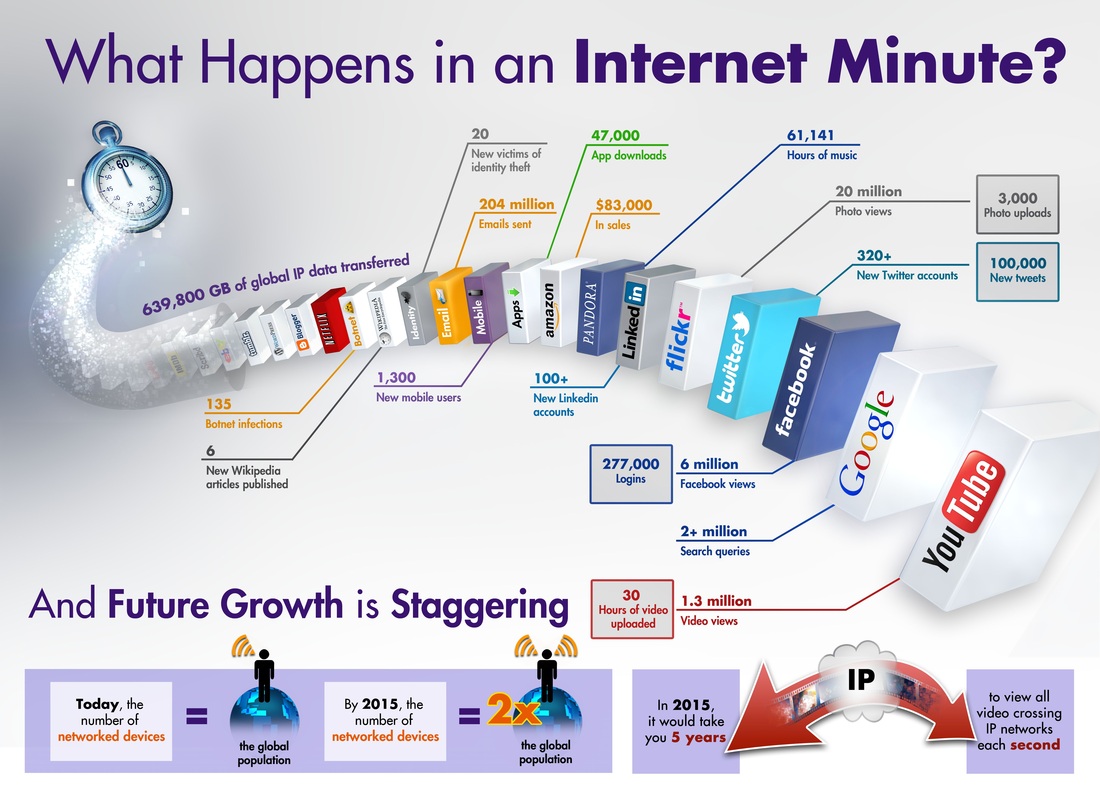 As you look at these examples, think about how much information is being conveyed in only one picture. It's quite a bit! Your ability to create a successful infographic depends on how successfully you can incorporate all of your information into a limited space, and in an interesting way.
Creating Your Own Infographic There are plenty of ways to create infographics. PowerPoint is a great tool for doing so, and most people already have the program installed on their PC. You can use it in conjunction with a powerful program like PhotoShop to create really beautiful graphics that catch the eye. You can also use other desktop publishing tools like InDesign or Publisher, or use an online tool like Infogr.am. It might also be useful to purchase an editing tool like SnagIt so you can create a .jpg or .png from your PowerPoint deck or publishing program. Licenses are only about $50, and you can do a free trial that gives you full access to all of its functionality.
0 Comments
Your comment will be posted after it is approved.
Leave a Reply. |
Contact me at info@writerliz.com.
Welcome to my blog. Please use the Category links below to find topics of interest to you, or just scroll through current postings. Receive new postings via email:
Categories
All
Archives
November 2014
|
 RSS Feed
